57 Keratoconus Statistics for 2026
Every number on this page was checked in the original journal article, review, or official report cited — not in a press summary or another website's citation. Where a figure could not be traced back to its source, we left it out.
A note on how to read this page. Each statistic is written twice. First in plain English, so you can understand what it actually means. Then in a smaller grey line marked The study, which carries the sample size, the margin of error, the study design, and anything that would make the number misleading if you quoted it out of context. If you're a patient or a family member, read the first part and ignore the second. If you're a writer or researcher who needs to cite something, the second part is where your details are.
What keratoconus is, in one paragraph. The cornea is the clear dome at the front of the eye. In keratoconus it gets thinner and gradually bulges forward into an uneven cone shape. Because the surface is no longer smooth, light scatters instead of focusing, and vision goes blurry and distorted in a way glasses usually can't fix — the distortion isn't a simple prescription error, so there's no lens shape that cancels it out. It usually starts in the teens or twenties and it runs in families.
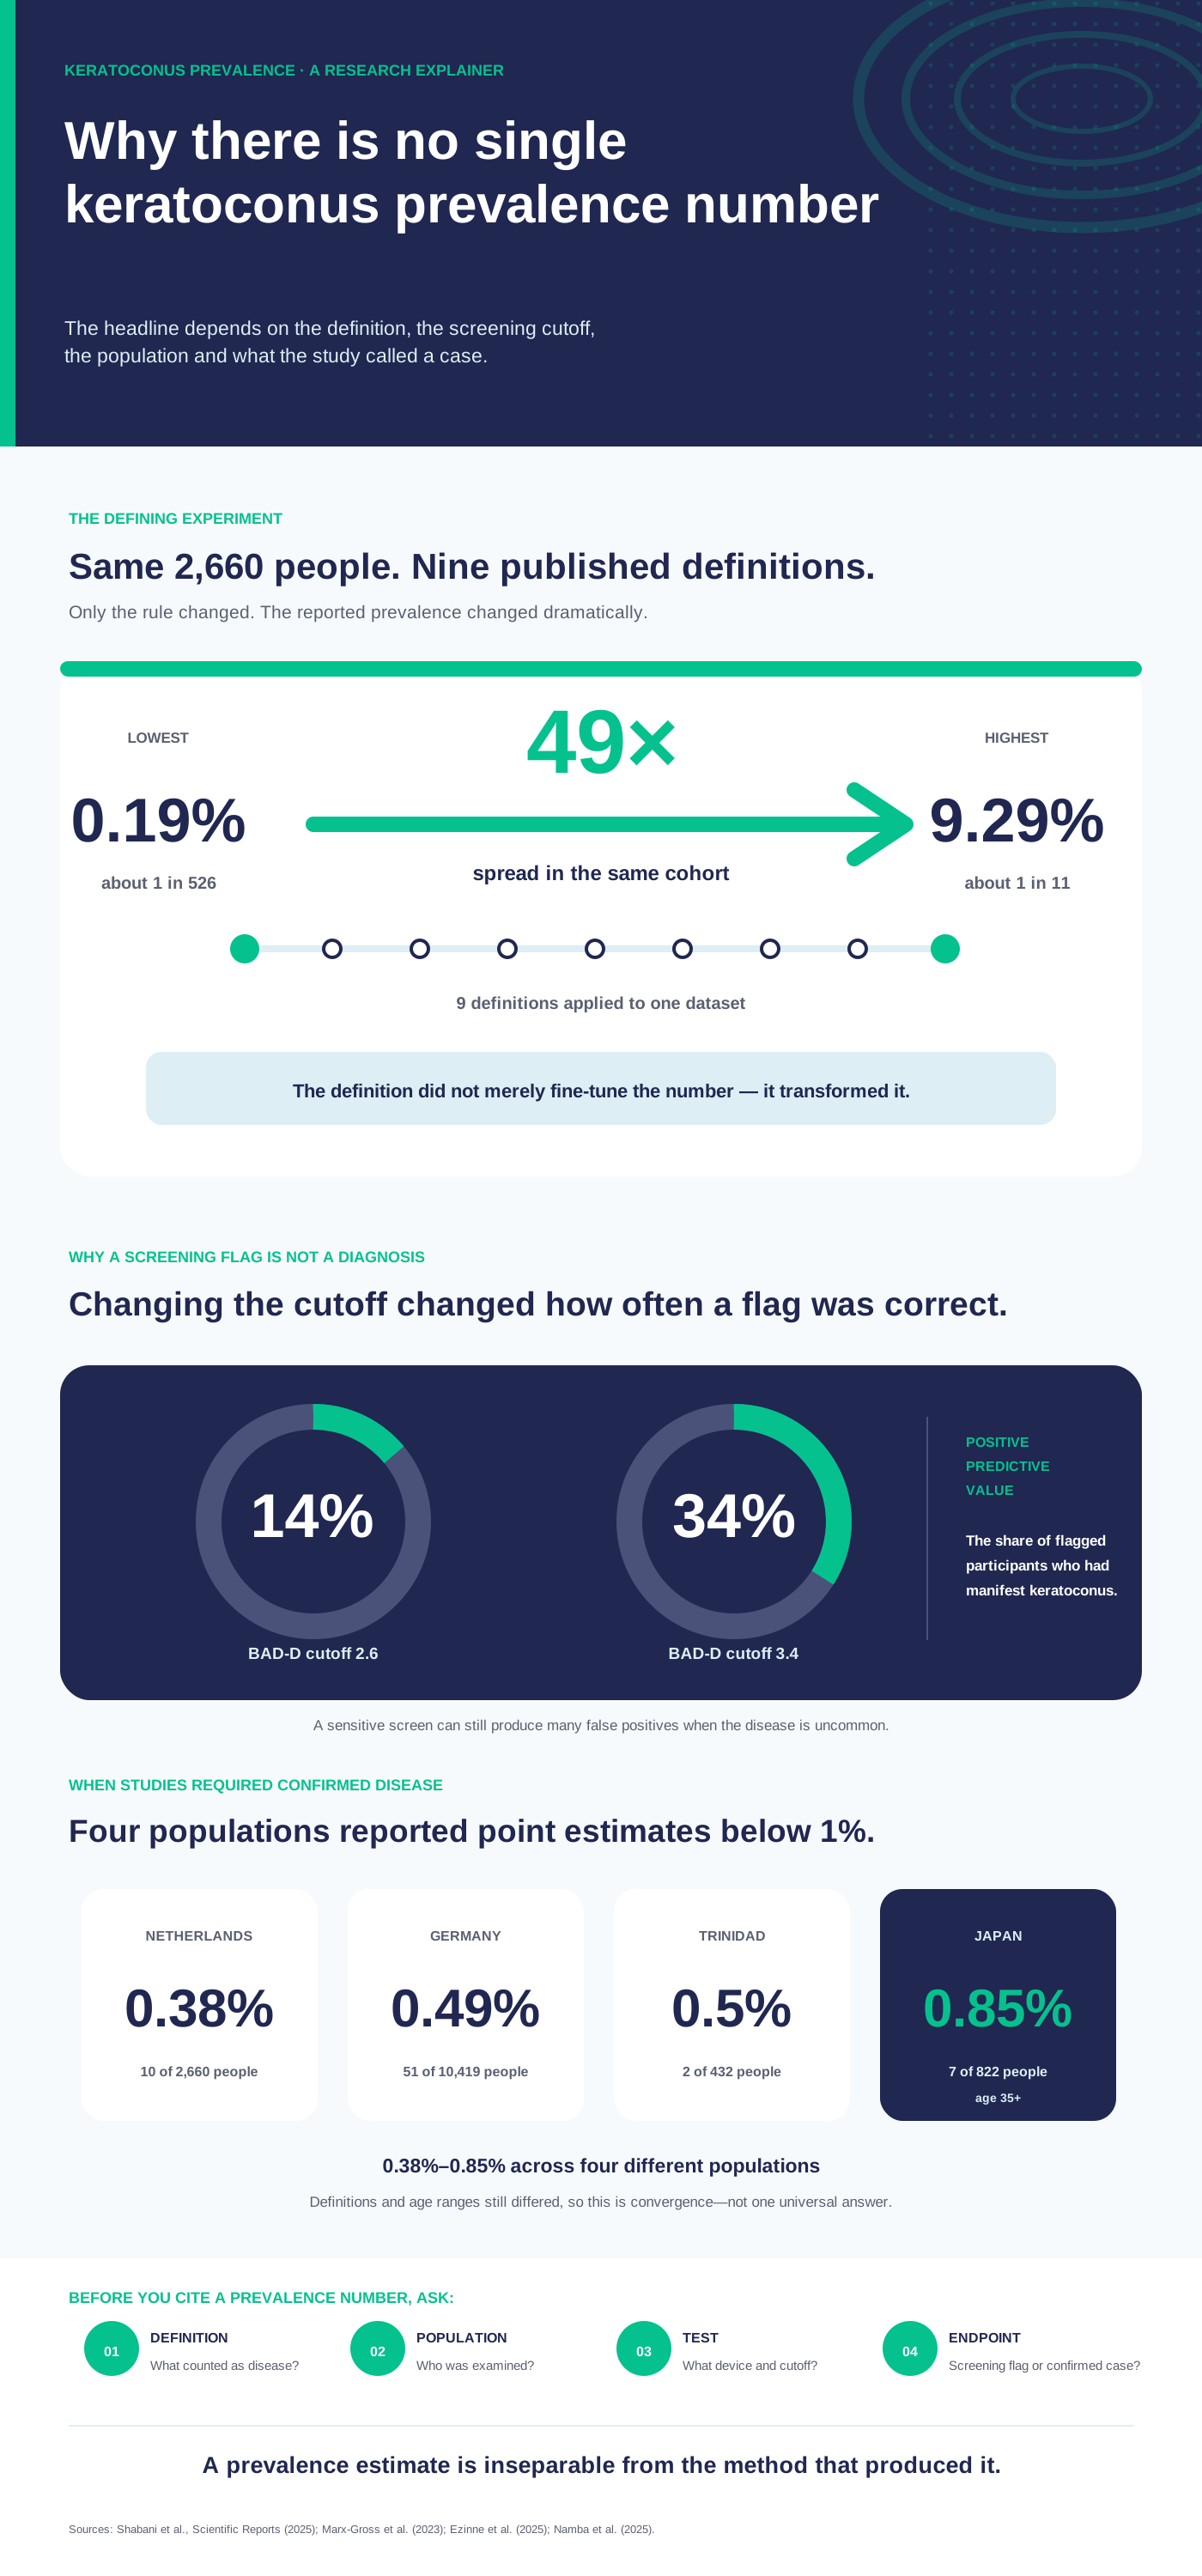
One thing to understand before any number below. Keratoconus is among the most inconsistently measured conditions in eye care. Researchers do not all agree on where a normal cornea ends and a diseased one begins, and the number you get depends enormously on where you draw that line. In one Dutch study, nine published definitions applied to the same group of people produced answers that differed by a factor of nearly fifty. That's why you'll see wildly different figures quoted elsewhere, and why we've put the explanation near the top of this page rather than burying it.
The five keratoconus statistics most worth citing
If you take only five numbers from this page, take these.
- Nine different published definitions of keratoconus, applied to the exact same 2,660 people, produced answers ranging from 0.19% to 9.29% — a 49-fold spread, from one group of researchers scanning one group of patients. (Statistic 15)
- Once you restrict the comparison to studies that required confirmed disease, the disagreement mostly disappears: 0.38% to 0.85% across four countries on three continents. (Statistic 19)
- People with keratoconus report rubbing their eyes far more often than people without it — the pooled odds are about six and a half times higher — the most consistently reported association in the entire literature, though nobody has established which way the arrow points. (Statistic 27)
- Corneal transplants for ectasia have fallen by three quarters since 2011, from 8,071 procedures a year in the U.S. to 1,967. The eye banks credit cross-linking and better rigid lens fitting. (Statistics 52–53)
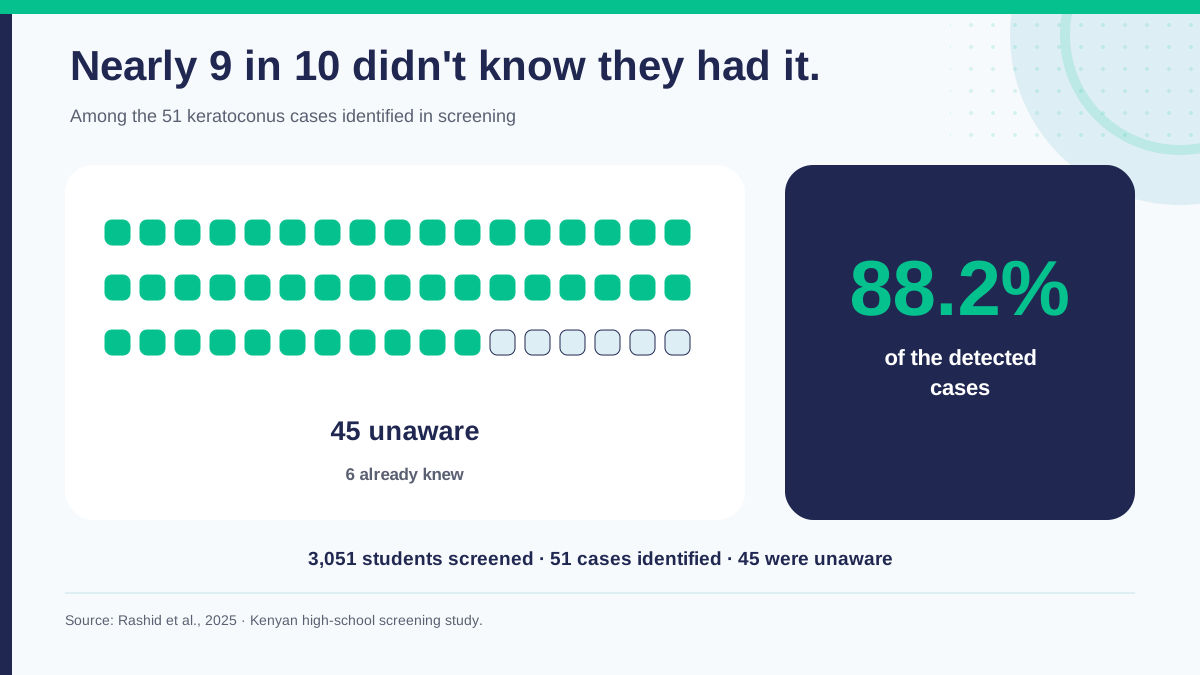
- In a Kenyan high school screening, 88.2% of the students found to have keratoconus had no idea they had it. (Statistic 11)
How common is keratoconus?
There is no single worldwide figure, and any source that gives you one without qualification is oversimplifying. What follows is what individual population studies actually found. Read the population along with the number — a study of Kenyan teenagers and a study of German 60-year-olds are not measuring the same thing, and the difference between them isn't necessarily a difference in disease.
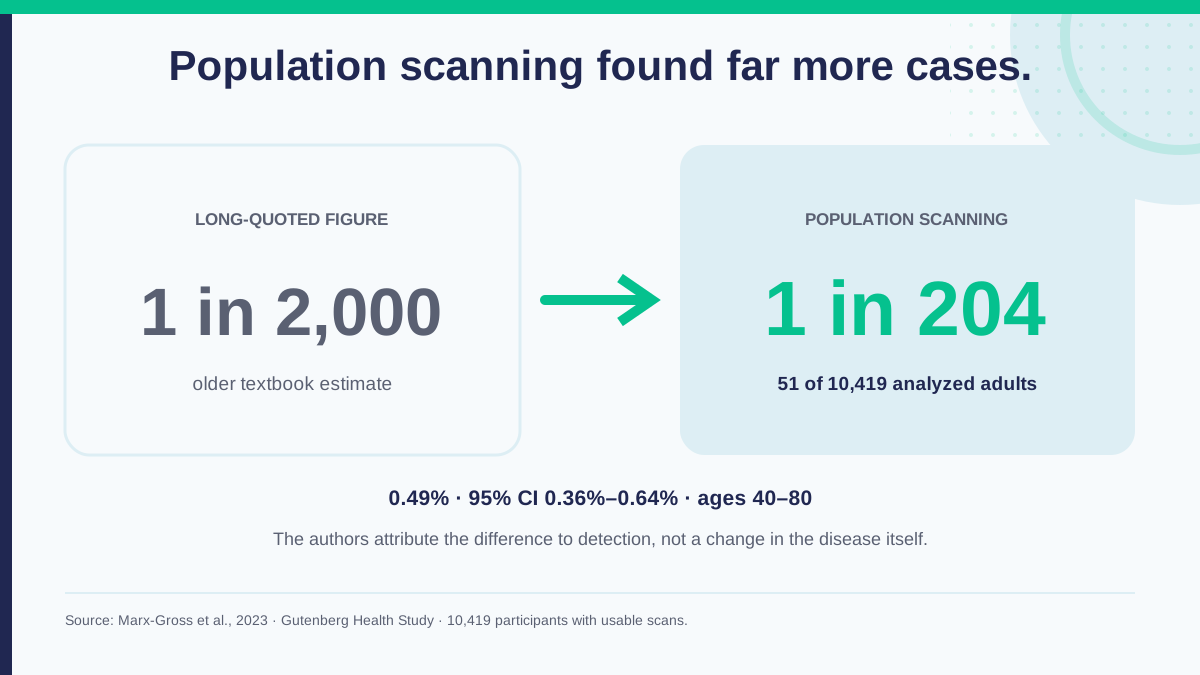
1Keratoconus turned out to be about ten times more common than the textbook figure — roughly 1 in 204 German adults.
For decades the number in the textbooks was 1 in 2,000. When German researchers scanned an entire population sample with a device that maps the whole cornea, front and back, rather than waiting for people to complain about their vision, they found it in 1 in 204 — "approximately tenfold higher than previously reported," in their own words. Their explanation isn't that the disease has become more common. It's that mild and early cases were always there and the old methods walked straight past them.
2Before modern scanning, published estimates ranged from 1 in 20 to 1 in 2,000.
That is a hundred-fold disagreement, and it is the honest summary of what the literature looked like. If you are looking for a single legacy figure to quote, this range is more truthful than any one number inside it.
3In a large Dutch study, 1 in 266 adults had confirmed keratoconus.
The Rotterdam researchers were unusually strict about this. Rather than accepting an existing definition, they built one from the evidence and applied it consistently — which makes this one of the cleaner prevalence figures available.
4In the same group, seven times as many people looked suspicious as actually had the disease.
This gap is the single most useful thing to understand about keratoconus statistics. Scanners flag a lot of corneas as unusual. Most of those people do not have keratoconus. Nearly all of the disagreement between published prevalence figures comes down to whether a study counted the flagged group, the confirmed group, or both together.
5In rural Japan, keratoconus was found in about 1 in 118 adults.
The authors' practical takeaway is aimed at surgeons: they stress how important it is to screen for keratoconus before LASIK, implantable lenses, or refractive cataract surgery, because operating on an undiagnosed cone can go badly.
6A further 1.46% of that Japanese group were flagged as possible cases.
Again, roughly double the confirmed rate — the same suspected-versus-confirmed gap showing up in a completely different population.
7Among Trinidadian high school students, keratoconus was found in about 1 in 200.
Two cases out of 432 students. That's a genuinely small number of cases, which is why the margin of error on this one is enormous — the true figure could plausibly be anywhere from almost none to more than three times the estimate. The authors' conclusion is not really about the percentage; it's that children are being underdiagnosed and schools should be screening.
8Among Kenyan high school students, 1.7% had keratoconus — roughly 1 in 60.
That is several times higher than the adult figures from Europe and Japan, in a much younger group. The authors recommend a national school screening programme on the strength of it.
9Another 3.8% of those Kenyan students were flagged as possible cases.
10Among Syrian university students, keratoconus was found in about 1 in 70.
In ten of the twelve cases, both eyes were affected — which is the usual pattern. Keratoconus is nearly always a two-eye disease, though it is often far worse in one.
11Nearly nine in ten Kenyan students found to have keratoconus had no idea they had it.
This is the most important number on the page for anyone who cares about early diagnosis. Early keratoconus is usually asymmetric, and one good eye covers for the other, so vision feels normal until the disease is well established. By the time it is obvious enough to send someone to an eye doctor, the easiest window for treatment may have closed. The authors also advise that every child with vernal keratoconjunctivitis — a severe allergic eye condition — be screened.
12Among Iranian hospital and university employees, keratoconus was found in about 1 in 102.
Worth reading carefully: this is a workplace, not a city. Employees of a medical university are not a cross-section of Shiraz, and the authors say so themselves.
13Sweden's national medical records show about 1 in 590 people carrying a keratoconus diagnosis.
Registry figures count people a doctor has actually diagnosed and coded. Screening studies count people a scanner can find. The registry number is lower for the obvious reason — undiagnosed cases don't appear in medical records. Both are correct; they answer different questions.
14Sweden records about 12 new keratoconus diagnoses per 100,000 people each year.
New cases per year is a different measurement from how many people have it in total, and the two get mixed up constantly in press coverage. This is the new-cases figure.
Why the estimates disagree so much
Most articles skip this section. It is the reason the numbers above look inconsistent, and it is the most useful thing on the page.
15Nine published definitions, one group of patients, answers ranging from 1 in 526 to 1 in 11.
Dutch researchers ran an experiment that should be better known. They took nine diagnostic definitions from nine other published studies, and applied all nine to the same 2,660 people, scanned on the same machine on the same day. Prevalence came out anywhere from 0.19% to 9.29% depending purely on which definition they used. Nothing about the patients changed. Only the ruler did.
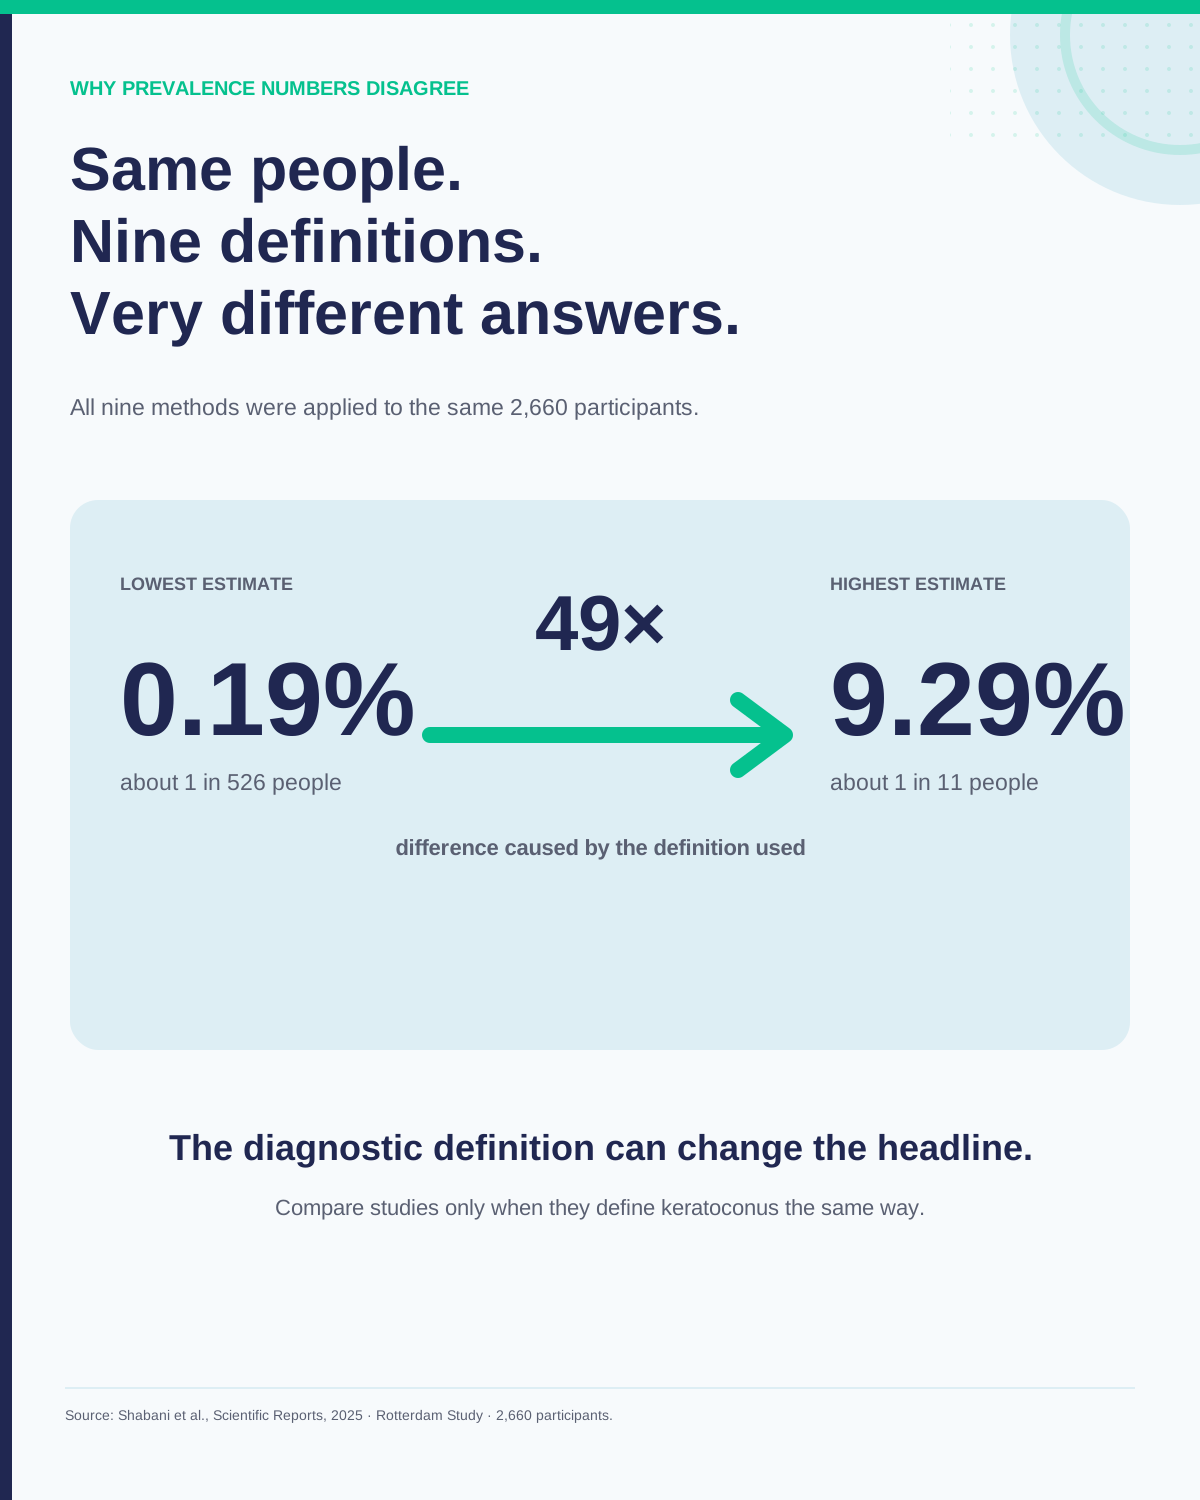
16The researchers' own verdict: comparing prevalence figures across definitions is "really challenging, if not improper."
Those are their exact words. Any article that lines up prevalence figures from different countries as though they were measuring the same thing is doing precisely what the people who ran this experiment warn against. The authors also caution that differences between countries "do not necessarily reflect true underlying prevalence differences."
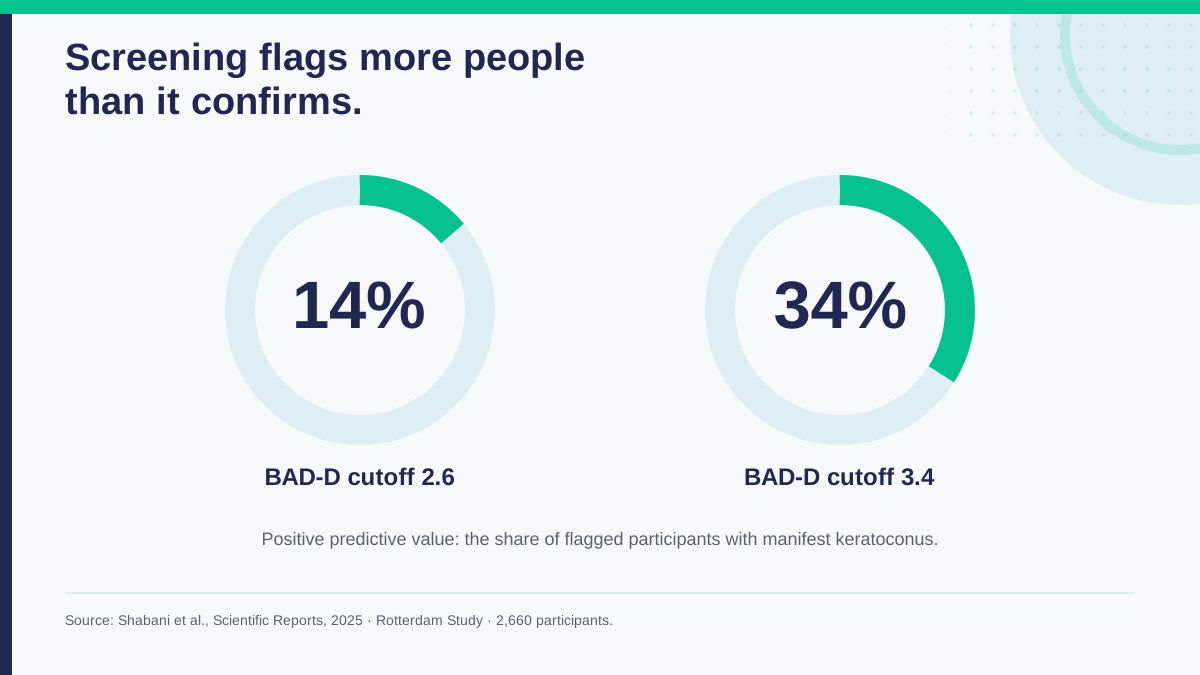
17A widely used screening threshold was wrong about six times out of seven.
Modern corneal scanners produce an automatic risk score. At the commonly used cutoff, only 14% of the people the score flagged actually turned out to have keratoconus. The other 86% were false alarms. This is the mechanism behind those alarming "keratoconus is far more common than we thought" headlines — a screening flag is not a diagnosis, and the researchers are blunt that the score "was never intended to function as a standalone diagnostic index."
18Raising the threshold helped, but two thirds of flagged people still didn't have the disease.
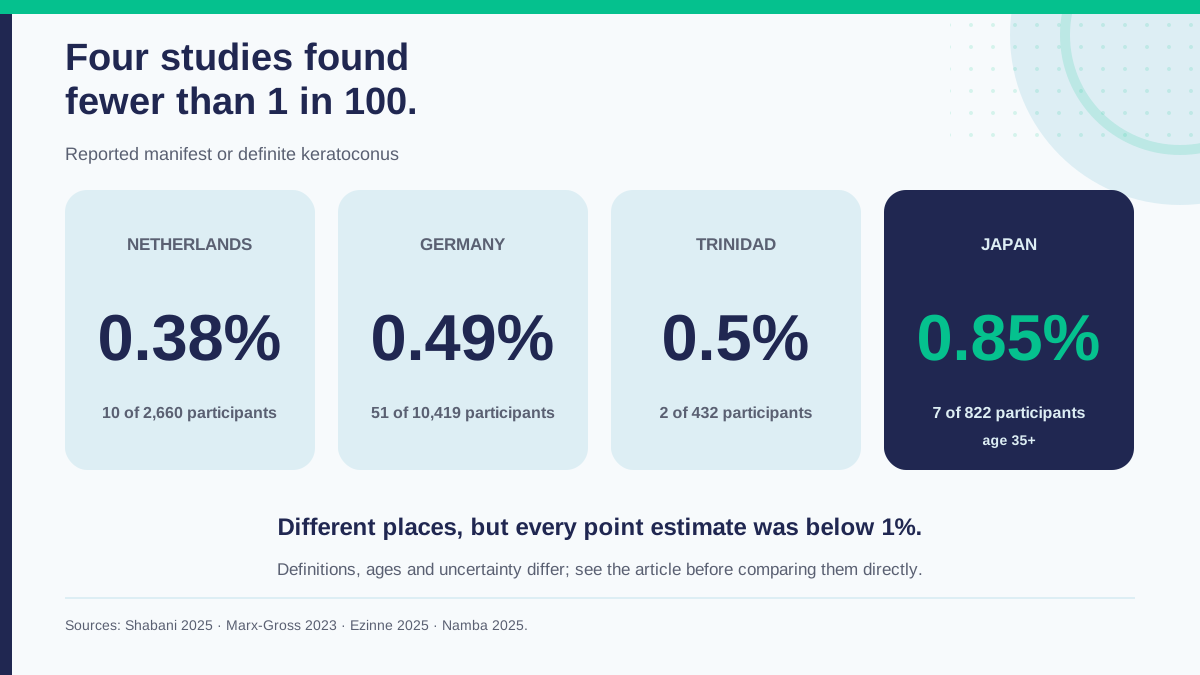
19When studies require confirmed disease, they land in a narrow band — 0.38% to 0.85% — despite running on three different continents.
Here is the encouraging part. Most of the apparent chaos in keratoconus prevalence figures is definitional, not real. Restrict the comparison to studies that required confirmed disease rather than a screening flag, and four independent research groups working in four countries land close together.
| Population | Prevalence | Margin of error | Ages |
|---|---|---|---|
| Netherlands | 0.38% | 0.20–0.69% | 40+ |
| Germany | 0.49% | 0.36–0.64% | 40–80 |
| Trinidad | 0.5% | 0.06–1.67% | 12–17 |
| Japan | 0.85% | 0.41–1.78% | 35+ |
Who gets keratoconus
20Three quarters of Sweden's diagnosed keratoconus patients are men.
Male predominance shows up repeatedly in European registries. It does not show up everywhere — see statistic 24, where a Korean national dataset found the opposite.
21Seven in ten diagnosed Israeli adolescents with keratoconus were male.
22Keratoconus was identified in 1 in 476 of nearly 900,000 Israeli adolescents.
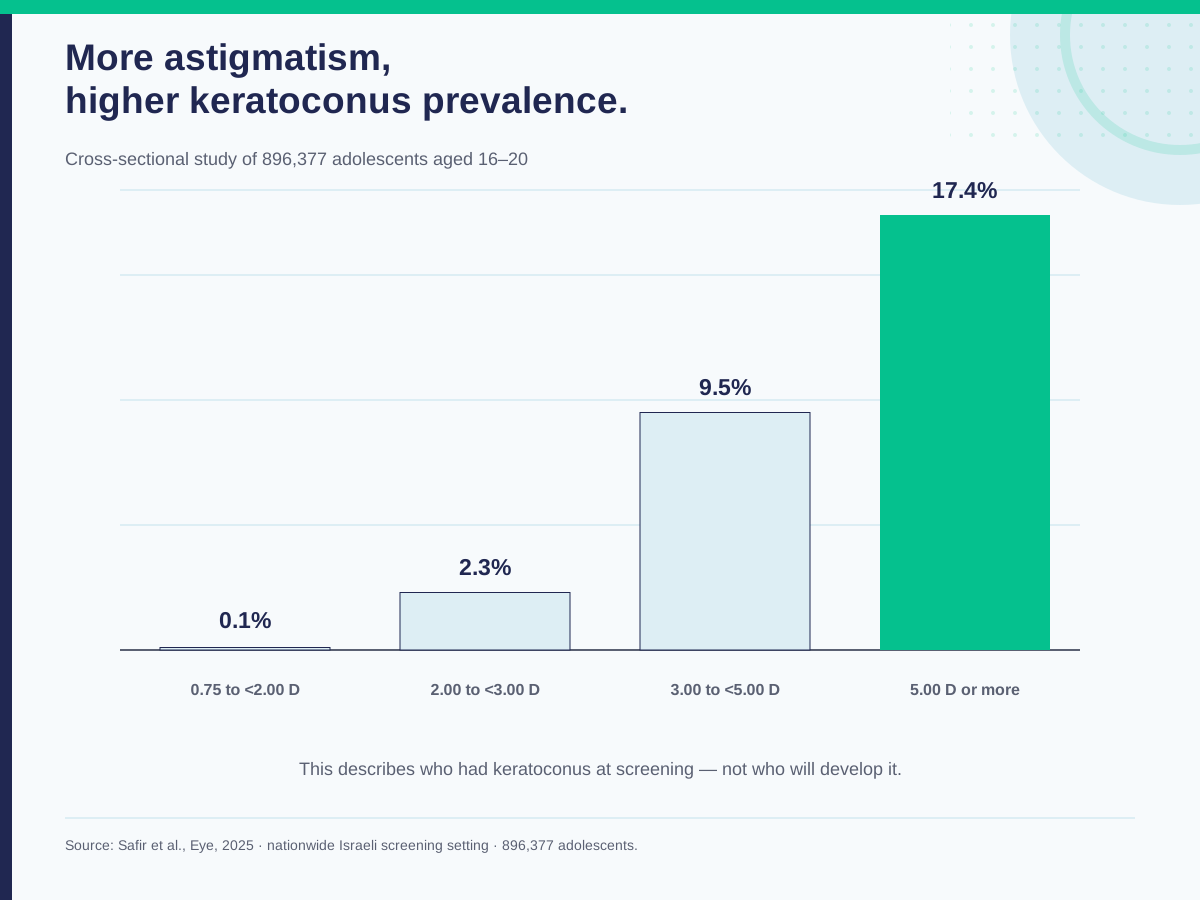
23The more astigmatism a teenager has, the more likely keratoconus becomes — from 1 in 1,000 at the low end to about 1 in 6 at the high end.
This is the steepest such gradient anywhere in the literature, and it has a practical use: high astigmatism in a young person is a reason to look at the cornea properly rather than just write a stronger prescription. The authors are careful about how far to push it — astigmatism on its own has only moderate diagnostic accuracy, and works best combined with clinical history.
| Astigmatism | Share with keratoconus |
|---|---|
| 0.75 to under 2.00 D | 0.1% |
| 2.00 to under 3.00 D | 2.3% |
| 3.00 to under 5.00 D | 9.5% |
| 5.00 D or more | 17.4% |
24In South Korea, women were diagnosed more often than men — the opposite of the European pattern.
Worth reporting rather than smoothing over. Two very large national datasets disagree about something as basic as which sex gets keratoconus more often, which should make anyone cautious about treating either result as a universal fact about the disease.
25New diagnoses peak in the twenties, then fall away sharply — in both Korean and Swedish data.
Two national datasets on opposite sides of the world agree on the shape of the curve even where they disagree on the levels. If you are in your twenties, this is the decade to take blurry, shifting vision seriously.
| Age band | Korea (per 100,000 person-years) | Sweden (per 100,000) |
|---|---|---|
| 20s | 10.695 | 26.1 (95% CI 16.1–36.1, ages 21–30) |
| 30s | 6.321 | — |
| 40s | 3.837 | — |
26In one UK region, Asian patients were diagnosed roughly seven times as often as white patients.
Read this one carefully before quoting it. The authors attribute most of the difference to marriage between close relatives within one specific Northern Pakistani community in their catchment area — keratoconus has a strong genetic component, and that raises the rate in any population where relatives marry. It is not a finding about South Asian patients generally.
What raises the risk
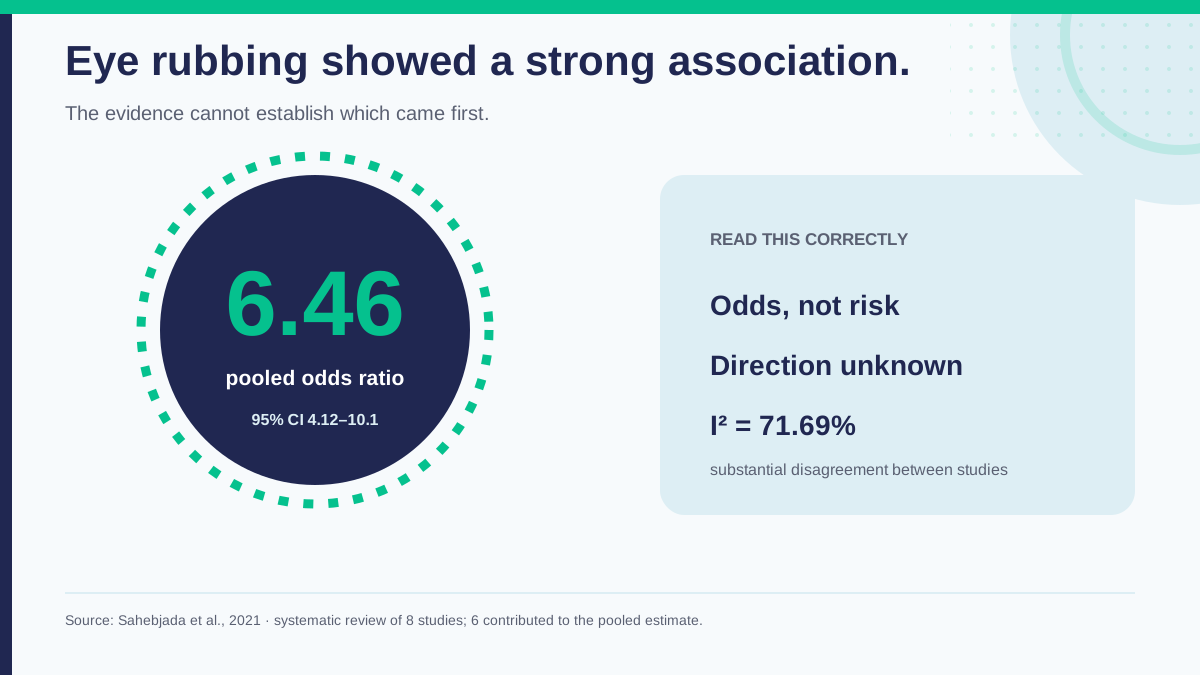
Read this before the numbers. Everything in this section is an association, not a proven cause. Some of these figures are very large, and large figures are strong evidence that something real is going on — but they cannot tell you which way the causation runs. The biggest analysis of eye rubbing says so directly: "the cause-effect temporal relationship cannot be determined." An eye that is already changing may itch more, which would produce exactly the same statistics.
27People with keratoconus report rubbing their eyes far more often — the pooled odds are about six and a half times higher.
This is the strongest and most consistent association in the literature, and also the most over-interpreted. The meta-analysis authors will not claim direction — an irritated, already-changing cornea may prompt rubbing just as easily as rubbing damages a cornea. The French group that studied rubbing behaviour in detail goes further than the statistics strictly allow and concludes that "helping people to stop eye rubbing could be an effective treatment on its own." That is worth knowing, because stopping is free and carries no downside.
28In a French study, the association was stronger still — about eleven times.
29Among people who rub at all, rubbing more than ten times a day stood out sharply.
The headline figure here is enormous and the uncertainty around it is even more enormous — the true value could be anywhere from about eleven times to a thousand. Never quote this number without its range attached. What survives the uncertainty is the direction: in the same study, how often people rubbed mattered more than how hard.
30Among people who rub, those who used their fingertips were less likely to have keratoconus than those who rubbed any other way.
The researchers' explanation is mechanical: knuckles and the back of the hand press bone directly against the eye, delivering far more force than a fingertip. This does not make fingertip rubbing safe — the comparison exists only among people who rub, so it says nothing about rubbing versus not rubbing at all.
31In a Chinese study the odds of reporting eye rubbing were about fifteen times higher among people with keratoconus.
32Family history was the single strongest risk factor in the French study.
If a parent or sibling has keratoconus, this is the number that should get you scanned — not eventually, but now, while you still have options. The uncertainty range is wide because relatively few people in any study have an affected relative.
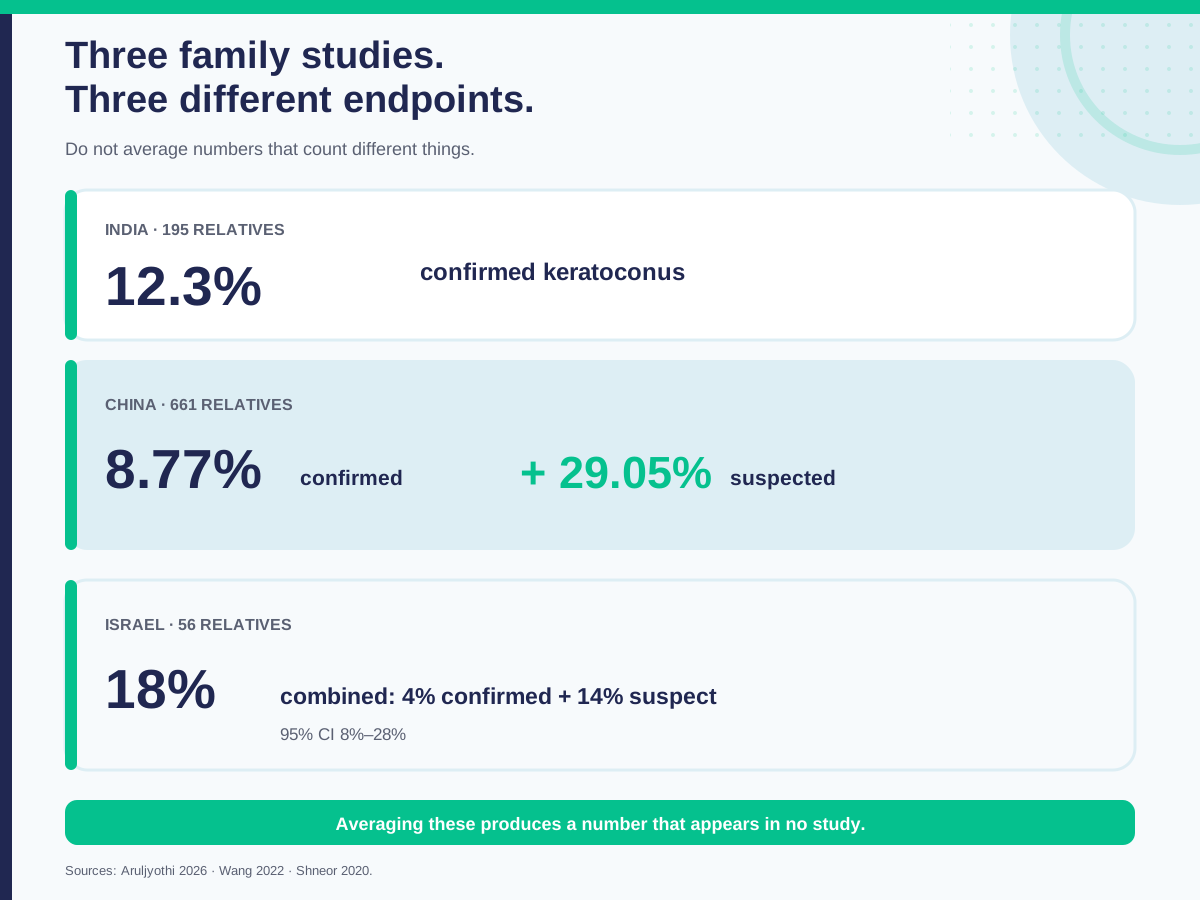
33Around one in ten close relatives of a keratoconus patient turns out to have it too — but the exact number depends entirely on what was counted.
This is why screening relatives matters, and it is also a good example of statistics that look comparable and aren't. One study counted confirmed disease. One counted a screening flag. One counted both and reported them added together.
| Study | Finding | What was counted |
|---|---|---|
| Aruljyothi 2026, India | 12.3% | Confirmed keratoconus on scanning |
| Wang 2022, China | 8.77%, plus 29.05% flagged | Screening score threshold |
| Shneor 2020, Israel | 18% of 56 relatives, 95% CI 8–28% | 4% confirmed + 14% flagged, combined |
34Allergy roughly quadruples to quintuples the association — and allergic people rub.
The two big risk factors are almost certainly connected through behaviour: allergy makes eyes itch, itchy eyes get rubbed. When Chinese researchers looked at people with both, the combined figure was very large — but the statistical test for whether the two multiply each other's effect came back negative, so this should be described as two risks stacking up, not as one amplifying the other.
35About one in eight people with Down syndrome in one study had keratoconus.
Many multiples of the general-population rate, and a strong argument for routine corneal screening in this group.
36People with keratoconus were nearly twice as likely to have sleep apnoea.
The suspected link is again mechanical rather than mysterious: sleep apnoea is associated with face-down and side sleeping positions that press on the eye for hours at a time. The review authors suggest eye doctors seeing these conditions should consider referring patients for a sleep apnoea assessment.
37Genetics researchers have identified 36 regions of the genome linked to keratoconus — together explaining an eighth of the inherited risk.
Which means most of the inherited component is still unaccounted for, and there is no useful genetic test for keratoconus today. Family history remains a far better predictor than any gene panel.
How keratoconus progresses
Read this before the numbers. Progression rates in different studies are not comparable, because "progression" means something different in nearly every paper — a 1.5 dioptre steepening in one, 1.00 in another, any measurable change beyond the machine's own error in a third. Each figure below is correct inside its own definition and meaningless outside it. Read the definition along with the number.
38In children and teenagers, half of eyes had progressed within about twenty months.
Keratoconus moves fastest in the young, which is why paediatric cases are treated more aggressively than adult ones. The Brazilian authors found that the steepest corneas progressed fastest and need close follow-up, and that allergy predicted progression too. They do not recommend a specific check-up interval anywhere in the paper, and neither will we — that is a decision for the person managing the case.
39Over six years of follow-up in adults, two thirds of eyes stayed stable — but some got worse and some got better.
The traditional teaching is that keratoconus burns out after the twenties. This Iranian cohort challenges that: change happened at every age studied, in both directions. The authors note that men may need closer monitoring, and also that corneal change does not always translate into worse vision or worse quality of life.
40The dramatic complication — a sudden flooding of the cornea — is rare: at least 1.43 per 1,000 keratoconus patients per year.
Corneal hydrops happens when the cornea's inner lining tears and fluid floods into the tissue. Vision drops abruptly, the eye becomes painful and red, and it usually leaves a scar. It is the thing people picture when they hear that keratoconus is serious, and it is uncommon. This figure is a floor rather than a best estimate: reporting into the surveillance system was voluntary, so missed cases can only push the real number up.
41When hydrops happens, it typically happens around age 32.
And it forces decisions quickly: one in five patients in the surveillance series had a transplant decision made within six months.
42At one specialist centre, 14.9% of patients with unstable keratoconus experienced hydrops.
Ten times the population figure in statistic 40, and the difference is entirely the denominator. This counts patients already referred to a major referral centre with disease known to be unstable, accumulated over nearly seven years. It is not an annual risk and it does not apply to keratoconus generally. The authors also found that the patient characteristics predicting hydrops looked like markers of access to care rather than biology.
43After hydrops in one eye, two thirds of the other eyes changed measurably over the following years.
The practical point the authors draw is about the eye that hasn't had the event yet: it needs watching. In their series, about a third of fellow eyes that were thick enough for cross-linking at the start had thinned below the treatable threshold by the time they were re-measured. Waiting has a cost, but so does treating every fellow eye immediately — the authors are explicit that this should be a shared decision between patient, family and clinician.
Corneal cross-linking
What it is. Cross-linking uses vitamin B2 drops and ultraviolet light to create new chemical bonds inside the cornea, stiffening it so it stops bulging. It is the only treatment shown to halt the disease rather than compensate for it. It does not undo damage already done, and it is not a substitute for lenses — most patients still wear them afterwards. Its whole value is in stopping things getting worse, which is why catching keratoconus early matters so much.
44Against untreated eyes in randomised trials, cross-linking flattened the cornea and improved vision by about one line on the chart.
This is the strongest evidence anywhere on this page — randomised trials, where patients were assigned to treatment or no treatment, which is the only design that can establish that a treatment works rather than that treated patients differ. The authors' verdict is measured: cross-linking "may be an effective option in stabilizing keratoconus," with long-term follow-up still needed.
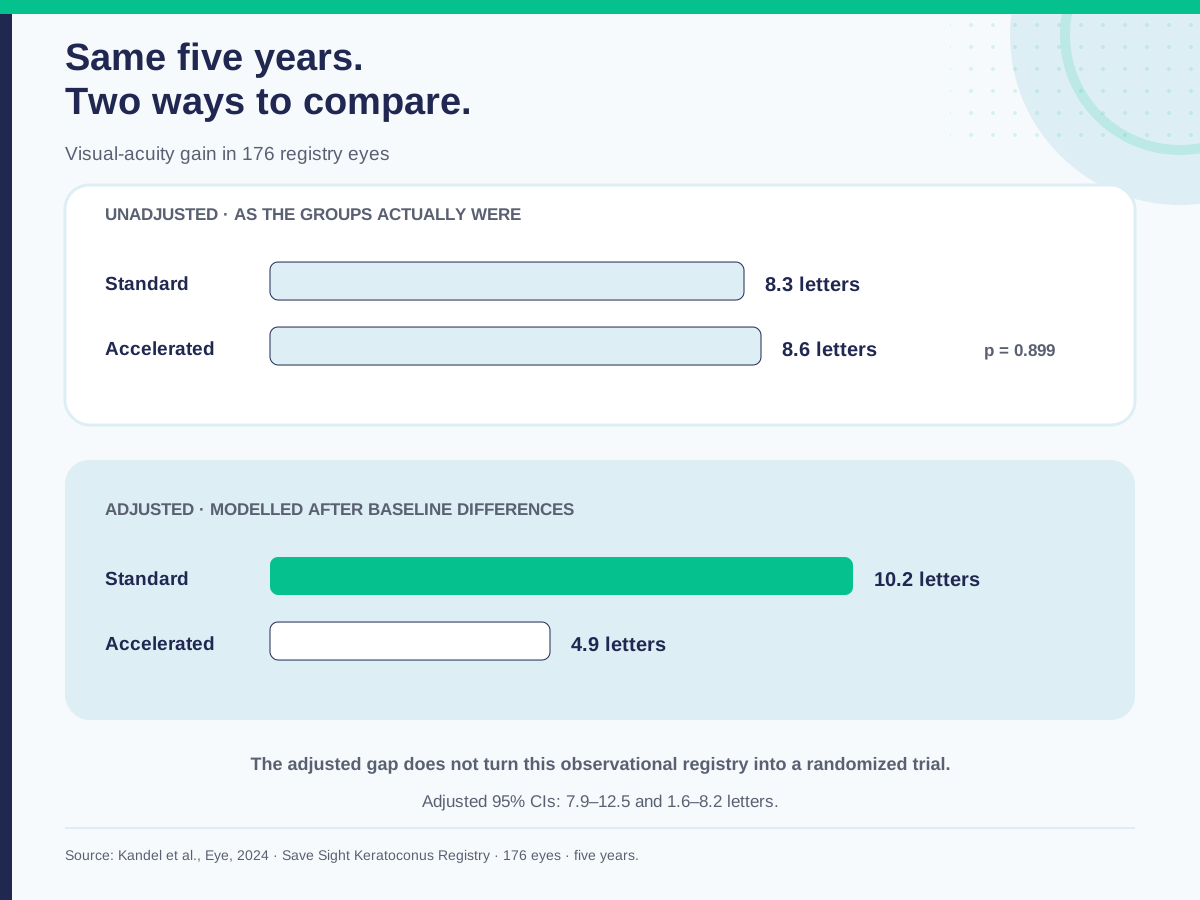
45Standard cross-linking beat the faster accelerated version at five years — but only after statistical adjustment.
Compare the two groups as they actually were and they look identical. Adjust for the fact that the accelerated group started with worse disease, and standard pulls ahead by about one chart line. Both protocols stabilised the cornea; the question is only whether one is somewhat better. The authors' own position is deliberately cautious: "at the current level of evidence, the standard corneal cross-linking protocol can be the preferred one."
46Complications over five years affected roughly one in five eyes — with no significant difference between protocols.
Two different numbers get quoted from this study and they measure different things: how many eyes had a problem at the five-year visit, and how many had a problem at any point across the five years. The second is the one that matters to a patient deciding whether to have the procedure.
47Leaving the cornea's surface layer intact or removing it made no measurable difference at 12 months — but the studies disagree too much for that to mean they're equivalent.
The surgeon can either scrape off the cornea's thin surface skin before applying the drops, or leave it on. Off is more painful to recover from; on is gentler but the drops penetrate less well. Pooled across 27 studies, the outcomes came out effectively identical — but the individual studies disagreed with each other so completely that the pooled figure has no stable meaning. This is absence of evidence for a difference, not evidence that the two are the same. The authors put it as the complete picture "still emerging."
48A separate analysis found the surface-off technique better on corneal steepening — but only in its two highest-quality trials.
A result that appears only after you filter down to two trials is thin ground for a superiority claim, and the technique carries real trade-offs: slower healing and more lasting haze.
49In a series of more than 2,000 treated eyes, about 9% developed corneal haze and 4% saw the treatment fail.
Useful context for anyone weighing the procedure: haze is the most common complication, most of it settles, and significant vision loss was uncommon.
50Ten years after cross-linking in childhood, 9% of eyes had started progressing again.
The longest follow-up available in children, and broadly reassuring — nine in ten eyes were still stable a decade later. But it is not permanent in everyone, and a small number needed further surgery.
51Sterile infiltrates — an inflammatory reaction after treatment — occurred in under 1% of patients.
Corneal transplant
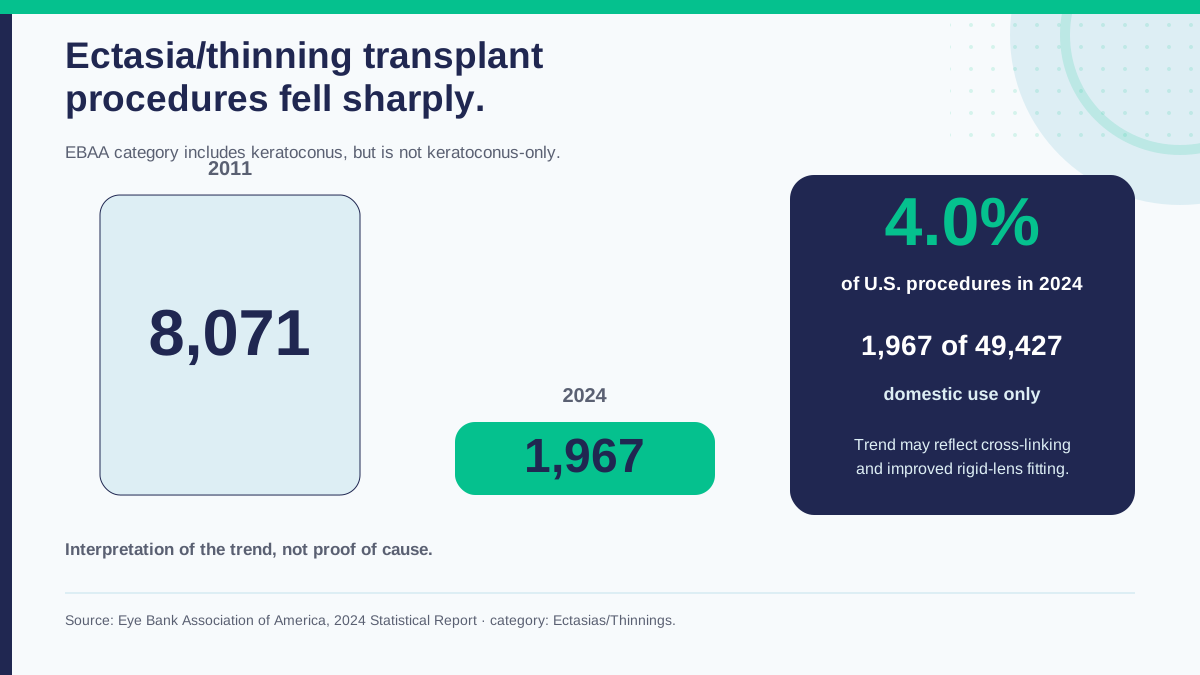
52Keratoconus and related conditions now account for just 4% of U.S. corneal transplants.
Transplant is the last resort, and it has become the exception rather than the expectation. Most keratoconus is managed with lenses, and increasingly with cross-linking to stop it getting worse. Note that keratoconus is still the leading single diagnosis within this category — the point is not that keratoconus rarely needs transplant, it's that the category as a whole has shrunk.
53That is down from 8,071 procedures in 2011 — a three-quarters drop in thirteen years.
This is arguably the most encouraging number on the page: a treatment arriving and a surgery receding. The eye banks attribute it directly to cross-linking and better rigid lens fitting, though they phrase it as an interpretation of a trend rather than a proven cause.
Lenses, vision and quality of life
Why lenses rather than glasses. Glasses correct a smooth surface that is the wrong shape. Keratoconus makes the surface itself uneven, so no lens sitting an inch away can undo it. A rigid lens works differently: it sits on the eye and the tear film fills the gap underneath, creating a new smooth optical surface. That is why vision in a well-fitted rigid or scleral lens can be dramatically better than anything glasses achieve.
54In the landmark U.S. keratoconus study, 78% of patients saw 20/40 or better in both eyes with correction.
The reference dataset for keratoconus outcomes, gathered before modern scleral lens practice existed. Most patients, most of the time, see well enough to function.
55Scleral lenses improved corrected vision by a little over four lines on the eye chart.
That is a large change — the difference between struggling and functioning. The review authors describe the improvements as substantial and sustained, while being candid that the underlying evidence is weaker than they'd like: no randomised trials, no comparison against other lens types, and little data past twelve months. One important caveat for expectations: scleral lenses correct the optics, they do not stop the disease. In one included study, 14.6% of eyes got worse anyway as the keratoconus progressed underneath.
56On a standard vision quality-of-life questionnaire, scleral lens wearers went from 52 out of 100 to 76 in three months.
Roughly a 45% improvement in how people rated their own vision-related quality of life, and they wore the lenses nearly eleven hours a day — which tells you as much as the score does. People do not wear something eleven hours daily unless it is working.
57Keratoconus patients score higher on depression scales — but are no more likely to carry a depression diagnosis.
Two findings that appear to contradict each other, from very different amounts of evidence: the symptom-score result pools two studies and 83 patients, while the null diagnosis result pools 23,838. The authors do not resolve the contradiction and say so plainly, calling for further research rather than offering an explanation. What they do conclude is that mental health belongs in the routine care of keratoconus patients — which makes sense for a condition that arrives in young adulthood, affects something as fundamental as sight, and is often diagnosed after years of being told nothing is wrong.
How we verified these statistics
Every figure above was checked in the cited journal article, review, or official report. Where we could only find a number quoted in a press release, a trade magazine, or another website citing a third website, we cut it — including several widely repeated keratoconus figures you will find elsewhere.
Five figures were dropped during fact-checking because they could not be verified at source: a scleral lens handling-difficulty rate that appears in a review's abstract but is not supported anywhere in its body; a frequently cited 1986 prevalence estimate whose original paper we could not obtain and whose reported value differs between secondary sources; figures from a 2025 meta-analysis available to us only through a trade summary; U.S. insurance-claims figures traceable only to a conference summary; and national graft registry percentages whose printed counts and percentages did not reconcile arithmetically. We would rather this page be shorter and right.
We also declined to write several sentences that would have read well and been untrue. Where a paper reports a finding but draws no recommendation from it, we report the finding and stop. Where two results in a paper contradict each other and the authors do not explain why, we say the authors do not explain why rather than inventing a reason.
If you are citing this page and want the underlying paper instead, every statistic links to it. If you believe a figure here is wrong, we want to know — accuracy is the entire point of the page.
Michigan Contact Lens fits specialty lenses for irregular corneas, including scleral lenses for keratoconus. If you are looking for a keratoconus specialist in Michigan, we see patients referred by optometrists and ophthalmologists across the state.
Cite or embed this page
Writers, researchers and clinicians are welcome to reuse this material. Everything below is ready to copy.
Cite this page
Embed the full infographic
Paste this into any post or page. It displays the whole graphic and credits this page with a link.
Embed a single chart
Most writers only need one figure. Choose a chart and copy its code.
Link to a single statistic
Every statistic on this page has its own address. Click the small # beside any statistic to copy a link that opens the page at that number.